
Dashboard – Maharashtra State Board of Technical Education
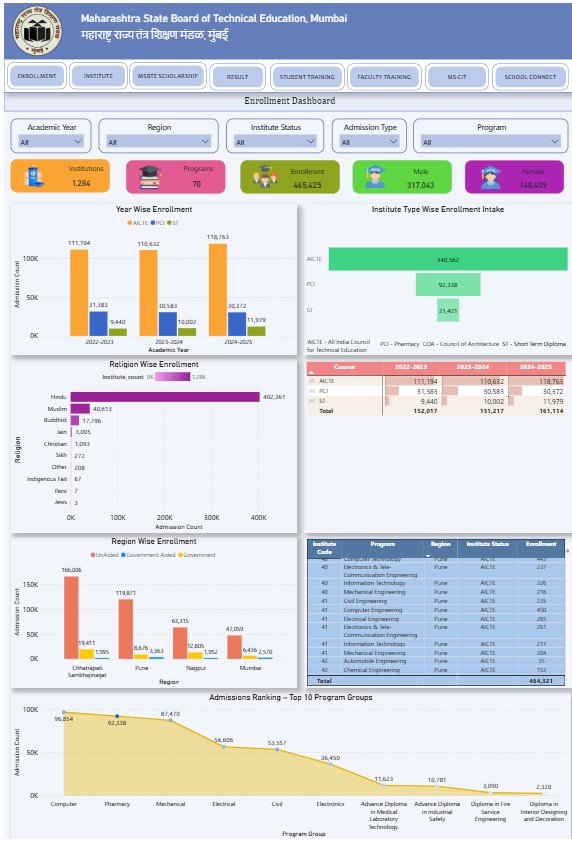
Dashboard
Problem
- Affiliation and intake decisions relied on scattered spreadsheets and manual reports, making it difficult to view capacity, demand trends, and compliance gaps in time.
- Examination and result monitoring lacked unified dashboards, preventing leadership from easily tracking registrations, paper delivery, and evaluation progress during critical windows.
- Student performance data sat in silos, which limited the analysis of learning outcomes, equity, dropouts, and scholarship impact needed for targeted support.
- Committees and regional offices spent significant time compiling ad-hoc MIS reports, leaving less capacity for strategic planning and policy initiatives.
- There was no common data model linking affiliation, enrolment, exams, results, and scholarships, hindering integration with state and national portals.
Solution
- Defined a Common Data Model linking students, institutes, and programmes to replace fragmented spreadsheets with a structured, governance-ready data backbone.
- Built automated ETL pipelines from existing MSBTE systems into a central analytics repository with validation and reconciliation checks.
- Designed role-based dashboards for the Board and regional offices with KPIs, filters, and drill-downs tailored to core functions like exams and scholarships.
- Conducted iterative pilots and trainings to refine indicators and visualizations based on user feedback and standardized SOPs for dashboard use.
- Integrated dashboards into routine governance—including Board notes and review meetings—so that decisions and interventions are driven by real-time data.
Outcomes
- Created a single, trusted data source for affiliation, enrolment, and exams, reducing conflicting figures and manual consolidation across sections.
- Board and regional offices now use live dashboards in reviews, enabling faster, evidence-based decisions on intake, new programmes, and exam reforms.
- Analytics revealed equity and performance gaps by region, gender, and category, guiding targeted trainings and scholarship outreach.
- Automated MIS and standard dashboards significantly reduced manual report preparation, freeing staff time for academic quality initiatives.
- Visibility of key indicators improved transparency and accountability, strengthening trust among institutes, students, and government stakeholders.
Challenges
- Legacy data was inconsistent and scattered, making the cleaning and mapping of historical records complex but essential for trustworthy dashboards.
- Defining a Common Data Model acceptable to all sections required negotiation, as each unit had its own formats, codes, and comfort levels with change.
- Limited analytics skills among staff meant dashboards were initially underused, requiring repeated training to move from “reports” to data-driven decisions.
- Integrating multiple legacy systems into one analytics layer exposed technical gaps and missing fields, requiring iterative ETL redesign.
- Change management was uneven, as some leaders continued to rely on old spreadsheets, slowing the cultural shift toward transparent, dashboard-based governance.
SKOCH Award Nominee
Category: State Government – Higher and Technical Education Department
Sub-Category: State Government – Higher and Technical Education Department
Project: Dashboard
Start Date: 1-06-2020
Organisation: Maharashtra State Board of Technical Education
Respondent: Pramod A. Naik
https://msbte.ac.in/
Level: Premium Plus
Video
See Presentation
Gallery


Case Study
Dashboard -Maharashtra State Board of Technical Education
The Maharashtra State Board of Technical Education (MSBTE) has historically managed the complex landscape of technical education across the state through a traditional, spreadsheet-driven administrative model. While functional, this approach led to significant challenges where critical data regarding affiliation, student enrollment, examinations, and scholarships remained trapped in fragmented files and departmental silos. This lack of a unified view meant that leadership often relied on delayed or manual reports for high-stakes decisions, such as approving institutional intake capacity or monitoring real-time examination integrity. To modernize these processes, MSBTE initiated an e-governance transformation centered on a robust architecture of integrated databases and interactive dashboards.
The core of this intervention was the development of a Common Data Model. By establishing shared keys—such as permanent student IDs (PRNs), standard institute codes, and uniform course identifiers—the Board was able to bridge previously isolated domains. This structural shift allowed MSBTE to move beyond “better spreadsheets” toward a sophisticated analytics layer. The implementation involved building automated ETL (Extract, Transform, Load) pipelines to pull data from various legacy systems into a central repository, ensuring that information was validated, reconciled, and updated in real-time.
The transition was not without significant hurdles. The Board faced substantial challenges regarding legacy data quality, where cleaning and standardizing years of inconsistent historical records proved to be a massive undertaking. Additionally, the cultural shift required for change management was uneven; moving staff and leadership away from familiar manual reports toward interactive dashboards required extensive training and a change in organizational habits. Technical gaps in older systems were often exposed during the integration process, necessitating iterative redesigns of the data pipelines to ensure accuracy and trust in the new system.
The results of this digital overhaul have been transformative for MSBTE’s operational efficiency. By replacing manual MIS work with automated, drill-down dashboards, the Board has successfully reduced the administrative workload for its regional offices and committees. Decision-makers now have immediate visibility into intake utilization and student performance trends, allowing for evidence-based policy adjustments. Furthermore, the analytics have highlighted critical equity gaps, enabling MSBTE to design targeted academic support and more effectively monitor the reach of social welfare scholarships. This has shifted the governance focus from merely processing transactions to improving student-centric outcomes and institutional accountability.
Looking ahead, the project is designed for continuous evolution and scalability. The modular nature of the dashboard architecture allows for the easy addition of new data feeds, such as placement tracking, industry internships, and faculty appraisals. MSBTE plans to move into predictive analytics, utilizing the accumulated data to identify students at risk of dropping out and to evaluate the long-term impact of various schemes. By establishing this “reusable governance engine,” MSBTE has not only solved immediate data silos but has created a durable foundation for future technical education reforms across Maharashtra
For more information, please contact:
Pramod A. Naik at director@msbte.ac.in
(The content on the page is provided by the Exhibitor)